Not Losing Weight in a Calorie Deficit? How to Tell a Plateau From Noise
The scale has stalled despite a deficit. How to check the trend, the weigh-in and the log before you cut anything — what water, glycogen and the cycle hide, and the ordinary tracking gaps that close a deficit.

Ten careful days, and the scale is exactly where it started. Before you take anything else off your plate, work out whether there is anything to take off.
The short answer: when a long enough weight trend refuses to fall, the average deficit you actually achieved was usually smaller than the one you planned — or the fat loss is real and temporarily hidden. A single morning proves nothing. Water, glycogen, salt, gut contents, a new training stimulus and, for menstruating people, the cycle each move the scale by more than a week of fat loss does. Check the data before you cut the food.
In short: A plateau is a claim about a trend, not about a morning. Weigh under the same conditions, read a rolling weekly average, and give it two to four weeks — normal day-to-day swing is commonly as large as the roughly 0.4–0.8 kg a week a sensible deficit produces for an 80 kg adult. If the trend really is flat across that window, the first suspect is measurement rather than metabolism: under-reporting intake and over-crediting activity is the best-documented reason careful dieters stall.
Sources checked 10 September 2026 against the primary literature listed at the end. Figures are quoted as published, with the population each came from named. This is general information, not medical advice.
Claimed deficit versus achieved deficit
Body weight follows energy balance over time: eat less than you use and, averaged out, you lose mass. Nothing on this page argues with that. The interesting question is a different one — how big was the deficit you actually achieved, as opposed to the one your calculator planned.
Those are rarely the same number, and the best-known study on the gap is still the most useful. Lichtman and colleagues took ten people who described themselves as diet-resistant, and measured what they really ate and really expended over 14 days. On average they under-reported their food intake by 47% and over-reported their physical activity by 51%. Their thermogenesis was normal. This was not deceit and it is not a moral failing — estimating your own intake is genuinely hard, and everybody is bad at it.
Two consequences follow. Nobody — not a coach, not an app — can look at an incomplete log and declare "you are not in a deficit"; what can be said is that your achieved average is unknown until the data is complete. And the missing energy is almost never one dramatic thing, but a handful of ordinary ones, listed further down.
So treat the number your calculator gave you the way our guide to daily calorie needs treats it: a starting estimate you correct with real data, not a measurement. If the number you are working from came from an activity slider, it is worth recomputing: our calorie deficit calculator counts your training as its own calories instead of folding it into a multiplier, which is the single assumption most likely to have put your maintenance — and therefore your deficit — in the wrong place.
Is this actually a plateau?
A plateau is a statement about a trend, so it needs enough readings to be a trend at all. Three things make one readable.
Weigh under comparable conditions. Same time of day, after the toilet, before eating, similar clothing. Comparability matters more than the hour you pick.
Read the average, not the day. A rolling seven-day average is the signal that moves with fat. In 80 adults weighed daily over months, Orsama and colleagues found a group-level weekly rhythm — heavier on Sunday and Monday, lighter through the week — so comparing a Saturday with a Tuesday tells you about the weekend, not about your diet.
Give it two to four weeks. A sensible loss rate is around 0.5–1% of bodyweight a week; Garthe's athletes were assigned 0.7% and 1.4%, and the slower group kept more lean mass. For an 80 kg adult that is 0.4–0.8 kg a week — often no larger than the swing between two ordinary mornings, which is why a single flat week means nothing.
If you have fewer than about ten weigh-ins spread over a fortnight, the honest answer is not "plateau". It is not yet judgeable, and the right response is more data rather than less food.
Mon
Weigh
Often the week's high — read it, do not react
Tue
Weigh
Same time, after the toilet, before eating
Wed
Weigh
Log the day fully, good or bad
Thu
Weigh
Note anything unusual: salt, travel, hard session
Fri
Weigh
Still comparable, even after a late dinner
Sat
Weigh
Weekend readings are part of the average
Sun
Average
Compare this week's mean with last week's
What the scale hides for a week or two
None of the following is fat, and every one of them can be larger than a week of fat loss.
- Glycogen and its water. Muscle and liver glycogen is stored in hydrated form, with roughly three to four parts water per part glycogen. A higher-carbohydrate weekend refills the tank; the scale reports the water.
- Salt. A saltier day or two shifts fluid before your kidneys settle it again. It is a fluid signal, not a fat signal.
- Gut contents. More fibre, more volume, different meal timing — all of it weighs something on the way through.
- New or unaccustomed training. Starting a programme causes muscle swelling and more stored glycogen. Doing the right thing can move the scale the wrong way first.
- The menstrual cycle. Measured across the cycle, body weight ran about 0.45 kg higher during menstruation than in the first week, matched by a rise in extracellular water. Compare like phase with like phase.
- Sleep and stress. Plausibly involved in appetite and fluid balance, and not a complete explanation for a flat month. Worth protecting; not a diagnosis.
The tracking gaps that quietly close a deficit
This is the section people skip because it reads like an accusation. It is not one: these gaps show up in everybody's log, and finding one is good news, because it is fixable.
- Cooking fat and dressings. A tablespoon of oil is roughly 120 kcal and disappears into a pan without ever being logged.
- What you drink. Juice, lattes, soft drinks and alcohol arrive without the meal that would remind you to record them.
- The unlogged mouthfuls. Tasting while cooking, finishing what the children left, the biscuit at the desk — individually trivial, collectively a day's difference over a week.
- Weekends and incomplete days. Five well-logged days and two vague ones is the most common shape of an "unexplained" plateau.
- Portions and database entries. Declared values are averages within tolerance bands rather than exact figures — EU labelling guidance sets those bands explicitly — and a crowd-sourced entry can be further off again.
- Restaurant meals. Portion size and how much fat went into the pan are both unknown. Estimate generously rather than optimistically.
- Watch and tracker calories. In a Stanford comparison of seven wrist-worn devices, heart rate was measured well but no device estimated energy expenditure with an error below 20%, and some were far worse. Treat "calories burned" as a rough trend, never as a credit you can eat back.
For a practical way through the label side of this, our guide to reading food labels covers what the numbers on the pack are actually promising.
Your everyday movement counts too
Training is the visible part of your expenditure. The bigger, quieter part is everything else — walking, standing, fidgeting, taking the stairs. When Levine's team overfed volunteers by 1,000 kcal a day for eight weeks, differences in that non-exercise activity explained a ten-fold difference in how much fat they stored. It moves the other way too, and without asking: a few weeks into a deficit people sit more and walk less, and none of it shows up in a food log.
Which is why "just train more" is not automatically the answer. A new load raises water weight first, adds hunger, and often buys itself back by removing movement elsewhere in the day. If your lifts have also stopped moving, the problem may be a training one — why training stops producing results covers that side. And enough protein is what keeps a deficit costing you fat rather than muscle.
The plateau check, in order
Work down this ladder. Each rung is cheaper and more reversible than the one below it, and most stalls are solved before the bottom.
- 1Complete the data7–14 days
Log every day fully, including the bad ones · Without complete days there is nothing to diagnose
- 2Standardise the weigh-inDaily
Same time, same conditions · Makes the average comparable
- 3Read the rolling average2–4 weeks
Week mean versus week mean · Separates the trend from the noise
- 4Note the special factorsOngoing
Salt, travel, cycle phase, new sessions · Explains most short flat stretches
- 5Compare target with intakeWeekly
Achieved average against the plan · Shows the size of the real gap
- 6Close the biggest gapOne change
Oils, drinks, weekends — whichever is largest · Usually enough on its own
- 7Adjust the target slightlyOnly if 1–6 are clean
A small, reasoned change · Last step, not the first
Two rules keep this honest. Change one thing at a time, or the next four weeks will not tell you anything. And do not reach for rung 7 first: there is no universal number of calories to cut, and cutting further on top of incomplete data usually buys hunger without buying loss.
The trend is the thing you actually want to see
Rungs 1 to 3 are all bookkeeping, and bookkeeping is what an app is for: complete days, a smoothed weight trend instead of a morning reading, and a rate in kilos per week you can compare with the fortnight before.
When this belongs with a professional
A stalled scale is usually a measurement problem. Some situations are not, and they deserve a person rather than an article:
- weight that changes without you intending it to, in either direction
- a current or previous eating disorder, or tracking that is becoming compulsive
- pregnancy or breastfeeding
- a diagnosed condition or a medication that affects weight, appetite or fluid balance
- persistent dizziness, weakness, hair loss, cycle changes or exhaustion
None of that is something to self-diagnose from a weight chart, and this page does not assess individual medications. Talk to your doctor, a registered dietitian, or — for disordered eating — a specialist service.
Reading the trend instead of the number
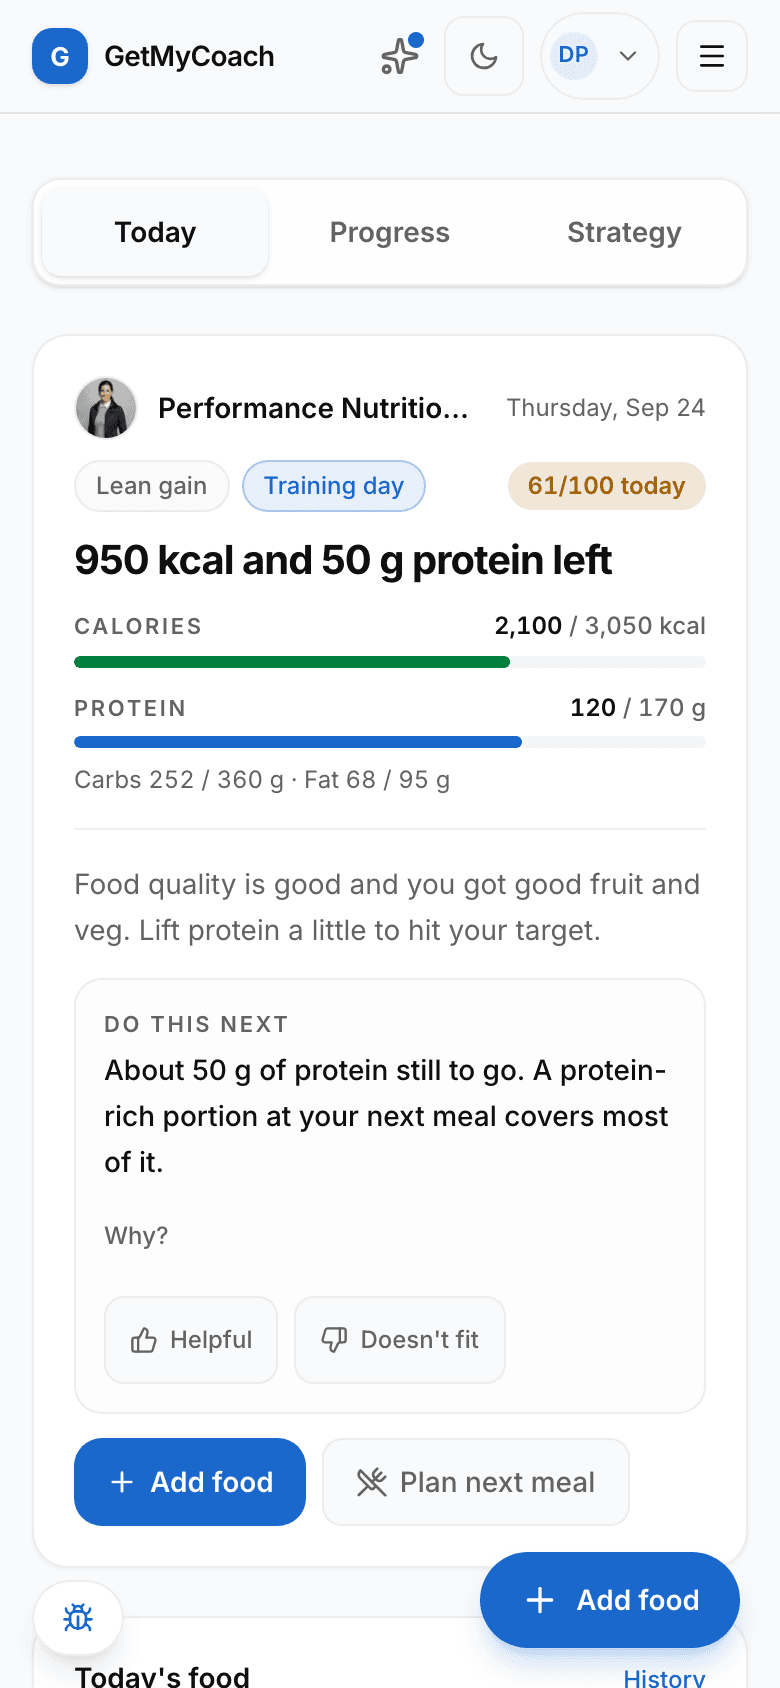
If you would rather not run that check in a spreadsheet, this is what the GetMyCoach nutrition tracker does with it. Only the days you actually tracked count towards a read, and today is left out until it is finished, so a half-logged day cannot flatter or spoil the picture; behind every read sits a "Why?" showing how many days and which values it rested on. Your weight appears as a smoothed trend with a rate in kilos per week and whether that rate is faster or slower than the period before — and when there are too few weigh-ins to be sure, no rate is reported at all rather than a confident-looking guess.
None of it needs a training plan. Set the goal, add your body basics, and the nutrition coach works from those alone — free during early access.
Frequently asked questions
Why am I not losing weight in a calorie deficit?
Most often because the deficit you achieved on average was smaller than the one you planned, or because the window is too short to show it. Measured against real intake, self-reports run far below the truth — one classic study found 47% under-reporting of food and 51% over-reporting of activity. Complete the data and read a two-to-four-week trend before concluding anything about your metabolism.
How long can water weight hide fat loss?
Days to a couple of weeks. Glycogen is stored with roughly three to four parts water, so a higher-carbohydrate weekend or a new training block masks real fat loss for a while. Across the menstrual cycle, body weight has been measured about 0.45 kg higher during menstruation, driven by extracellular water rather than fat.
When does a stall actually count as a plateau?
When a rolling weekly average has not moved across two to four weeks of comparable weigh-ins. A moderate deficit moves an 80 kg adult by roughly 0.4–0.8 kg a week, which is often no larger than ordinary day-to-day variation — so anything shorter is noise, not a plateau.
Should I just cut my calories further?
Not as a first move, and not while the data is incomplete. Work through the check above; the gap is usually in what is being logged rather than in the target. If everything checks out and the trend is genuinely flat, a small, reasoned adjustment is reasonable — there is no universal number that applies to everyone.
How accurate are the calories my watch reports?
Not accurate enough to eat back. In a comparison of seven wrist-worn devices, heart rate was measured well but none estimated energy expenditure with an error under 20%, and the worst were far off. Use the figure as a rough trend, not as a budget.
Can stress or poor sleep stop weight loss?
They can plausibly make it harder, through appetite and adherence, but neither is a complete explanation for a flat month, and treating them as one usually delays finding the real gap. Protect sleep because it makes everything else easier, not because it is the missing lever.
The bottom line
- A plateau is a trend, not a morning. Comparable weigh-ins, a rolling average, and two to four weeks before you judge.
- Suspect the measurement before the metabolism. Under-reported intake and over-credited activity is the best-documented cause of a careful diet that stops working.
- Water is not fat. Glycogen, salt, gut contents, a new training stimulus and the menstrual cycle all move the scale more than a week of fat loss does.
- Change one thing, then wait. Complete the data first; adjusting the calorie target is the last rung of the ladder, not the first.
Stop arguing with a single morning
Log normally for two weeks and let your coach do the bookkeeping: complete days only, one prioritised thing to change, and your weight as a trend with a real rate per week. No training plan required.
Sources
- Lichtman SW et al. (1992). Discrepancy between self-reported and actual caloric intake and exercise in obese subjects. N Engl J Med 327:1893–1898 — 47% under-reporting of intake and 51% over-reporting of activity, with normal thermogenesis
- Kreitzman SN, Coxon AY, Szaz KF (1992). Glycogen storage: illusions of easy weight loss, excessive weight regain, and distortions in estimates of body composition. Am J Clin Nutr 56(1 Suppl):292S–293S — glycogen stored with three to four parts water
- Orsama A-L et al. (2014). Weight rhythms: weight increases during weekends and decreases during weekdays. Obes Facts 7(1):36–47 — 80 adults, 4,657 daily weigh-ins; the weekly rhythm behind Monday-versus-Thursday comparisons
- Garthe I et al. (2011). Effect of two different weight-loss rates on body composition and strength and power-related performance in elite athletes. Int J Sport Nutr Exerc Metab 21(2):97–104 — 0.7% versus 1.4% of bodyweight per week in athletes who also lifted
- Kanellakis S et al. (2023). Changes in body weight and body composition during the menstrual cycle. Am J Hum Biol 35(11):e23951 — about 0.45 kg higher body weight during menstruation, matched by extracellular water
- Shcherbina A et al. (2017). Accuracy in wrist-worn, sensor-based measurements of heart rate and energy expenditure in a diverse cohort. J Pers Med 7(2):3 — heart rate accurate, no device under 20% error for energy expenditure
- Levine JA, Eberhardt NL, Jensen MD (1999). Role of nonexercise activity thermogenesis in resistance to fat gain in humans. Science 283(5399):212–214 — non-exercise activity explained a ten-fold difference in fat storage under 1,000 kcal/day overfeeding
- European Commission (December 2012). Guidance document for competent authorities for the control of compliance with EU legislation on the setting of tolerances for nutrient values declared on a label — declared values are averages within tolerance bands, not exact figures